Are Stock Markets Rising While the Economy Collapses? Have They Become Detached from Reality?

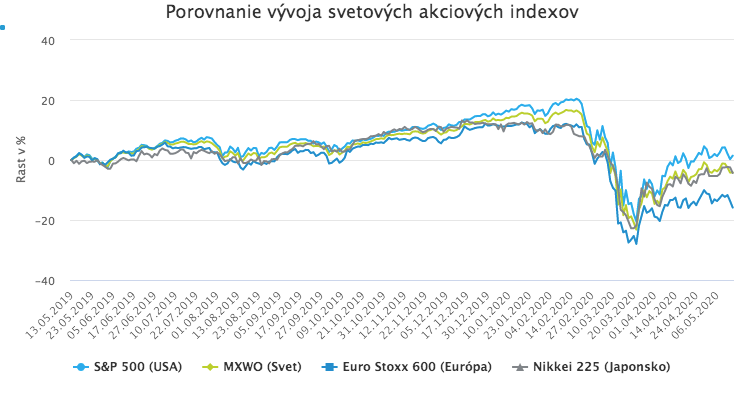
Despite some decline in the first half of this week, the major global stock markets have, on average, risen by more than 20% from the March low. Yet while markets were rising, virtually all indicators of real economic performance were simultaneously plunging to the worst levels in modern market history. Many people shake their heads in disbelief at this situation, and in recent weeks a quip spread even among investors: “If people kept as much distance from each other as markets keep from reality, COVID would not stand a chance.” When examining the reasons for this contrast, we will focus primarily on the U.S. stock market. It is both the largest and most important stock market in the world, and at the same time the market that has risen the most sharply in recent weeks, creating the starkest contrast with economic reality. Many of the statements below, however, also apply to other global markets.
A widening gap
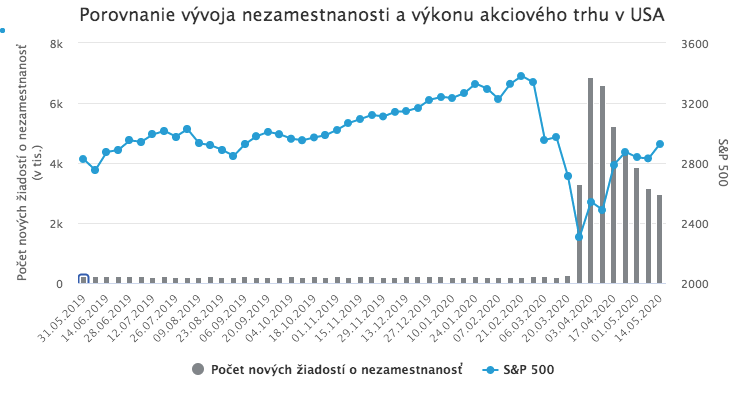
The contrast between market performance and the state of the real economy was most pronounced in the United States in April, when the benchmark S&P 500 rose by 15% while the real economy was in free fall and unemployment jumped to 14.7%. This situation gave rise to many striking charts showing a rapidly widening gap between the stock market and the real economy, and to even more striking media headlines: “20.5 million Americans lost their jobs in April, the stock market recorded its best monthly performance in 33 years,” “The economy is in its biggest crisis since the 1930s, stocks are rising,” “Stocks posted their strongest weekly gain since 1974 as more than 6 million people lost their jobs.” Attempts to explain this apparent contradiction between market performance and the real economy most often (besides simply tapping one’s forehead and waving it away) emphasize the fact that markets always look several months ahead. A market rally in the middle of a crisis thus signals investors’ expectation that the economy will recover quickly from the crisis thanks to massive stimulus. But in reality, this explanation does not hold up. The reality is considerably more complicated.
The myth of a rapid economic recovery
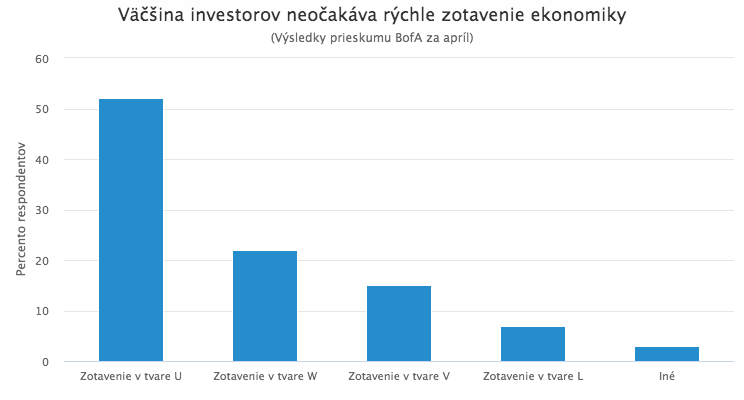
First of all, most investors do not, in fact, expect a rapid recovery. A Bank of America survey of global fund managers, which is among the best indicators of market sentiment, showed that in April only 15% of investors expected a quick V-shaped recovery. The majority, as many as 52%, expected a U-shaped recovery. That means a sharp drop, a longer recession, and only then a recovery. The strong market rally in April, at a time of sharp declines in virtually all macroeconomic indicators, therefore cannot be explained simply by the (nonexistent) expectation that the economy would quickly rebound from the crisis. Multiple factors, as well as the way the situation is interpreted, play a role.
The stock market does not represent the entire economy
The sharp contrast between stock market movements and the real economy seems surprisingly, even shockingly, stark only if you assume that the stock market should more or less reflect the state of the entire economy. In reality, that is not true. The long-term correlation between inflation-adjusted GDP growth and stock market performance is negative. Jay Ritter, a professor at the University of Florida who studied the long-term relationship between economic growth and stock market returns, concluded that “in the long run, no such empirical relationship exists.” Moreover, only a fraction of all companies in the economy have publicly traded shares. In the United States, only 1% of roughly 600,000 existing companies are listed on stock exchanges. In other advanced economies, not to mention developing ones, this share is even lower. Companies that are publicly traded typically belong to the largest and highest-quality firms in the economy. The stock market therefore includes only a small sample of companies, with above-average quality and capital strength. At the same time, the changing structure of the economy means that these largest and highest-quality firms employ fewer and fewer people. In the 1960s, the two U.S. companies with the largest market capitalization, AT&T and General Motors, employed as many as 1.2 million people. It was therefore reasonable to assume that strong performance by these firms would, to some extent, benefit a large part of the population. Today, the two U.S. companies with the largest market capitalization, Microsoft and Apple, employ only 280,000 people. The very expectation that the stock market should reflect the performance of the entire economy and the average company therefore makes little sense. Even more distorted expectations arise when U.S. stock market performance is measured by the S&P 500, as is often the case, creating an entirely misleading expectation that the S&P 500 should somehow precisely reflect the performance of the entire U.S. economy and the economic reality of a large part of the population.
The S&P 500 does not represent the entire stock market
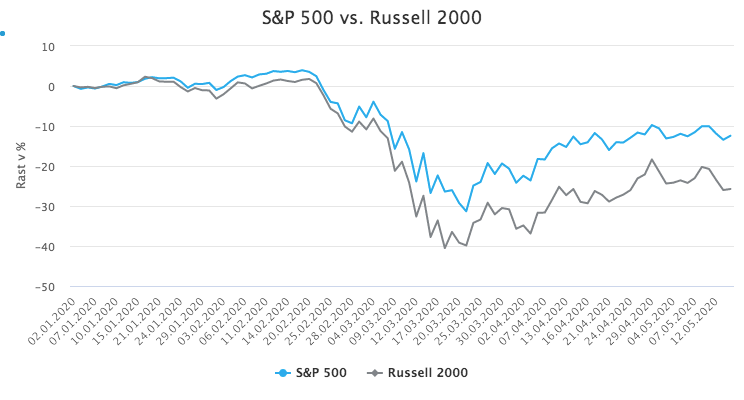
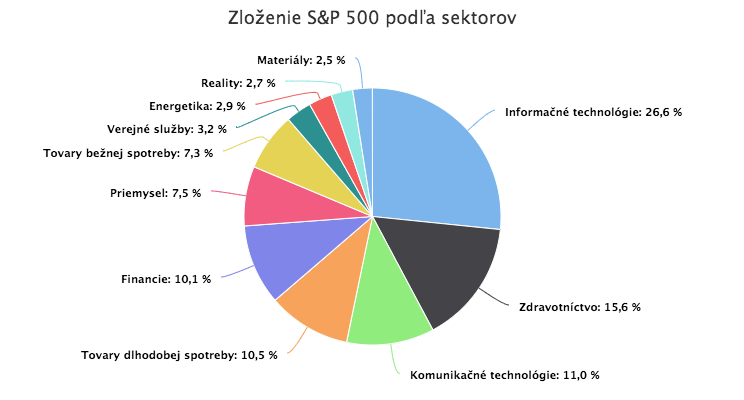
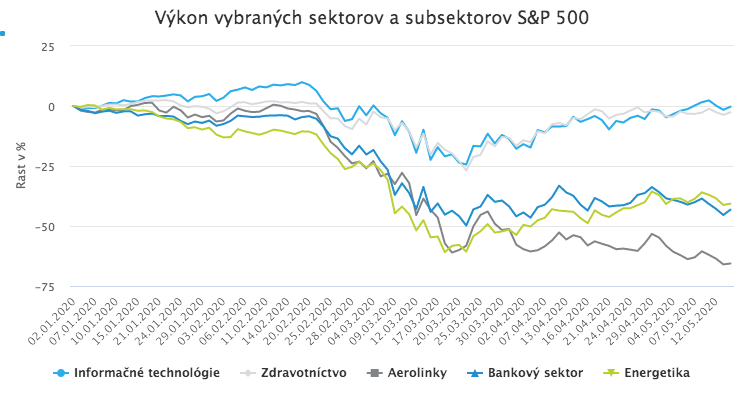
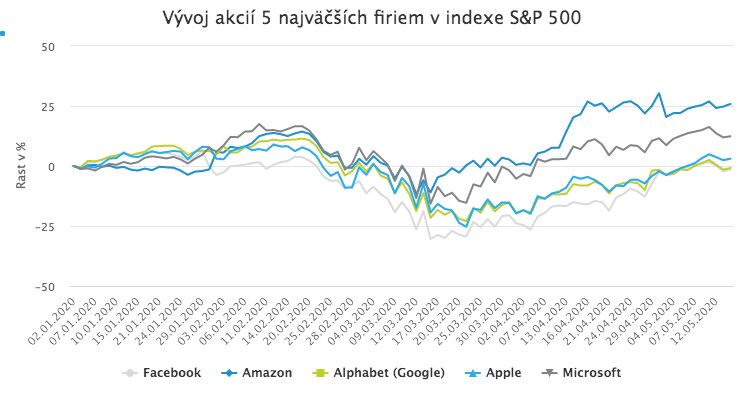
The S&P 500 index, considered a benchmark for the entire U.S. stock market, measures the performance of 500 U.S. companies with the largest market capitalization. When someone writes “the U.S. stock market rose by…” they usually refer to the S&P 500. However, equating the entire U.S. stock market with the S&P 500 is problematic. The S&P 500 measures the performance of the 500 largest companies. Yet company size has an important influence, especially in crisis periods, on performance, access to financing, and potential government support. As a result, there can be, and currently is, a significant difference between the performance of the largest companies in the stock market and the rest of smaller companies. While the S&P 500, after the gains of recent weeks, is only 12.4% below its level at the start of the year, the small-cap Russell 2000 index, which measures the performance of U.S. companies with smaller market capitalization, is still 25.7% below its level at the start of the year. That means there is more than a 13% gap since the start of the year between the average performance of the 500 largest U.S. companies and the 2,000 smaller ones. When interpreting the performance of the S&P 500, it is also important to keep in mind its sector composition and the weight of individual companies. The largest sector in the index, accounting for as much as 26%, is information technology. IT companies are, understandably, affected far less by the current crisis than, for example, restaurants or manufacturing firms. For many, the crisis has even improved the outlook due to expectations of accelerated automation trends, the possible role of information technologies in fighting the pandemic, and so on. The second-largest sector in the index is healthcare, with more than 15%. In other words, two sectors that have likely been hit the least by the crisis make up as much as 42% of the index. Sectors that are among the most affected, by contrast, have a much smaller weight in the index: energy has a 2.9% weight, banks 3.6%, and airlines only 0.15%. The weight of individual companies also plays an important role. The S&P 500 is a market-cap-weighted index, meaning companies with the largest market value have the highest weight. The growing market power of the biggest technology firms means that the concentration of the five largest companies in the index now exceeds the levels seen at the peak of the tech bubble. Just five “big tech” companies known collectively as FAAMG (Facebook, Amazon, Apple, Microsoft, Google-Alphabet) together account for as much as 20% of the index. These five firms have also been doing well during the pandemic. For example, Amazon’s shares have risen by 25.8% since the start of the year despite the pandemic. Microsoft is up 12.4%, Apple 3%. Facebook (-1.42%) and Google (-0.86%) have declined, but only slightly. The S&P 500 therefore does not reflect, and has no reason to reflect, the performance of the average U.S. company’s stock. It measures the performance of the largest and highest-quality companies, mostly in sectors least affected by the crisis. The widespread practice of equating the performance of the S&P 500 with the performance of the entire U.S. stock market, or even the entire U.S. economy, is therefore problematic and leads to incorrect interpretations. “The sharp rise in the U.S. stock market” in media headlines is thus partly a result of how it is measured using the S&P 500, which skews the perceived performance of the overall market upward in favor of the largest companies least affected by the crisis. However, other factors also played a role, above all the Fed’s monetary stimulus and behavioral factors.
Betting your money against the one who creates it?
Governments and central banks around the world responded to the COVID crisis with massive stimulus. While these measures were not aimed directly at the stock market, they significantly supported it indirectly. This is especially true of the U.S. Federal Reserve’s actions. The Fed responded to the crisis primarily by rapidly cutting interest rates to zero, injecting liquidity, massively purchasing government bonds, and even purchasing corporate bonds rated below investment grade. These measures not only prevented liquidity from drying up, made it easier for companies to access financing, reduced their interest costs and the present value of expected future revenues, but above all sent investors an important signal: the Fed is determined to do whatever it takes to prevent the market from collapsing and to stop companies from going bankrupt en masse. Some investors and analysts are even convinced that if stocks started to fall sharply again, the Fed, like the Bank of Japan, would move toward direct support of equity markets by purchasing equity ETFs. When the world’s most important central bank is willing to do whatever it takes to support the market, it does not pay to bet on the opposite outcome. Even the most successful investors have a limited amount of capital. The Fed, however, like any central bank issuing its own currency, can deploy unlimited resources to achieve its goals because it creates them itself, with a click on a computer. As a result, even the largest investors do not dare to bet on a market decline, because they do not want to enter an uneven fight against the Fed. Instead, they stay on the sidelines or “go with” the Fed and buy.
The FOMO and TINA effects
Stock gains during a crisis are also supported by the so-called TINA effect, which is again partly a consequence of central bank interventions. The acronym TINA (There Is No Alternative) refers to investors’ belief that today there is no investment alternative other than stocks. Cutting interest rates to zero and the decline in yields on higher-quality bonds close to zero, in some cases even into negative territory, means that markets practically offer no alternative to equities that provides comparable liquidity and the chance for a solid return. By many indicators and valuation techniques, stocks are significantly overvalued and offer one of the worst historical ratios between price and expected returns. In relative comparison to bonds, however, they are still the most attractive since the 1950s. Investors seeking meaningful returns therefore, despite everything, have practically no choice but to invest in equities. The TINA effect was thus one of the factors pushing stocks higher in recent weeks. Once equities managed to rebound from the March bottom and logged several days of solid gains, another factor began to drive them upward: FOMO. FOMO (Fear Of Missing Out) describes investors’ fear of missing returns from a rising stock market. When the market starts to rise, no one wants to miss the chance to profit from the move, especially fund managers whose performance is measured against equity benchmarks. Once the market starts to climb more strongly, the FOMO effect pulls additional investors into the market and further strengthens the rally.
It depends which “reality” we compare it to
The sharp rise in stock markets in recent weeks against the backdrop of a collapsing real economy and rising unemployment therefore has its reasons. Whether markets are detached from reality depends on which reality we choose to compare them with. If we compare the recent performance of the U.S. stock market measured by the S&P 500 with the current economic reality of the average U.S. company or the average population sample, we inevitably conclude that stock markets are detached from reality. But if we recognize that this comparison does not make sense, because the stock market does not measure the performance of the entire economy, and the S&P 500 does not measure the performance of the entire U.S. stock market but only a sample of the largest companies, many of which operate in sectors least affected by the crisis, backed by a central bank with unlimited resources, while investors also have few other places to invest, then the “disconnect from reality” no longer appears so obvious.